This is an old revision of the document!
Table of Contents
 This page is not fully translated, yet. Please help completing the translation.
(remove this paragraph once the translation is finished)
Processmonitoring Client (PMC)
The Processmonitoring Client provides an overview of the time lapse of a process. This feature can only be used when specific times for all activities have been defined and the CPM has been activated. Within the PMC the estimated timing of events is displayed in a diagram.
| Element | Description |
|---|---|
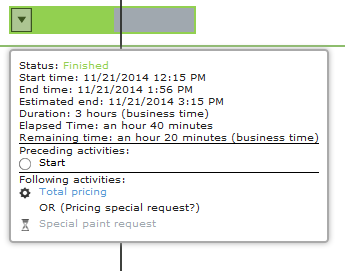
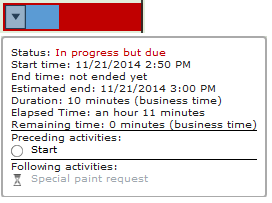
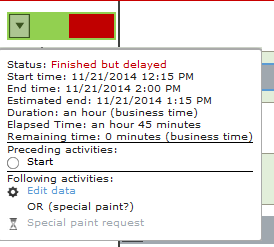
| 1 | In this section temporal progress is depicted by a diagram. The vertical black line indicates the current time line. Each activity has its own dedicated time line with its length corresponding to the estimated time required for processing assignments. An activity which is currently undergoing processing is highlighted by a blue color-code. An activity is highlighted by green color if it is successfully completed within the predefined time frame. Furthermore, the degree of the filling of this bar represents the lapsed time the processing of this particular activity required. If an activity takes longer than initially expected, the entire time line will be highlighted in red color-code. The background of the rows representing distinct activities is alternatingly colored either light green or white for reasons of distinguishing between different activities. |
| 2 | The preferred process definition can be selected via this drop-down menu. |
| 3 | Each of the process instances related to the selected process definition is distinctively shown in a list. The most recent instances appear on top of this list. |
| 4 | In case of selected process instances this options gives the unique opportunity to determine which activity should be shown. |
| 5 | This options enables the decision to exclusively display activities with a certain status. |
| 6 | This field allows you to decide if only activities with starting points within a certain time range will be displayed. |
| 7 | At the same time activities with ending points lying within a certain time range may be shown. |
| 8 | This option gives you the discretion to only display activities with expected starting points matching a certain time range. |
| 9 | This field enables you to decide if only activities will be shown which are assigned to a certain user in his or her capacity as an assignee. |
| 10 | The list of all activities can be arranged and sorted according to a wide range of elements. |
| 11 | Within this search field filters can be applied to the list of activities. |
| 12 | With this option the settings of a certain time range can be changed in order to search more effectively for desired activities. In this option settings relating to the dates of starting and ending like days (d) and hours (h) can be selected. |
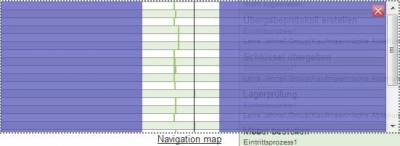
| 13 | With the option Navigation map the user can decide which section of the client he would like to view. By rearranging the purple-colored bars a particular section can be displayed and enlarged as desired.  |
 Relevant information will be shown by clicking on the arrow displayed in each row representing an activity of an instance. The arrow opens a drop-down menu. This additional window panel shows how many tasks within the selected activity have been finished by now. In addition, information on the person responsible for executing as well as the point in time for ending is provided.


