Table of Contents
Properties
| Element | Description |
|---|---|
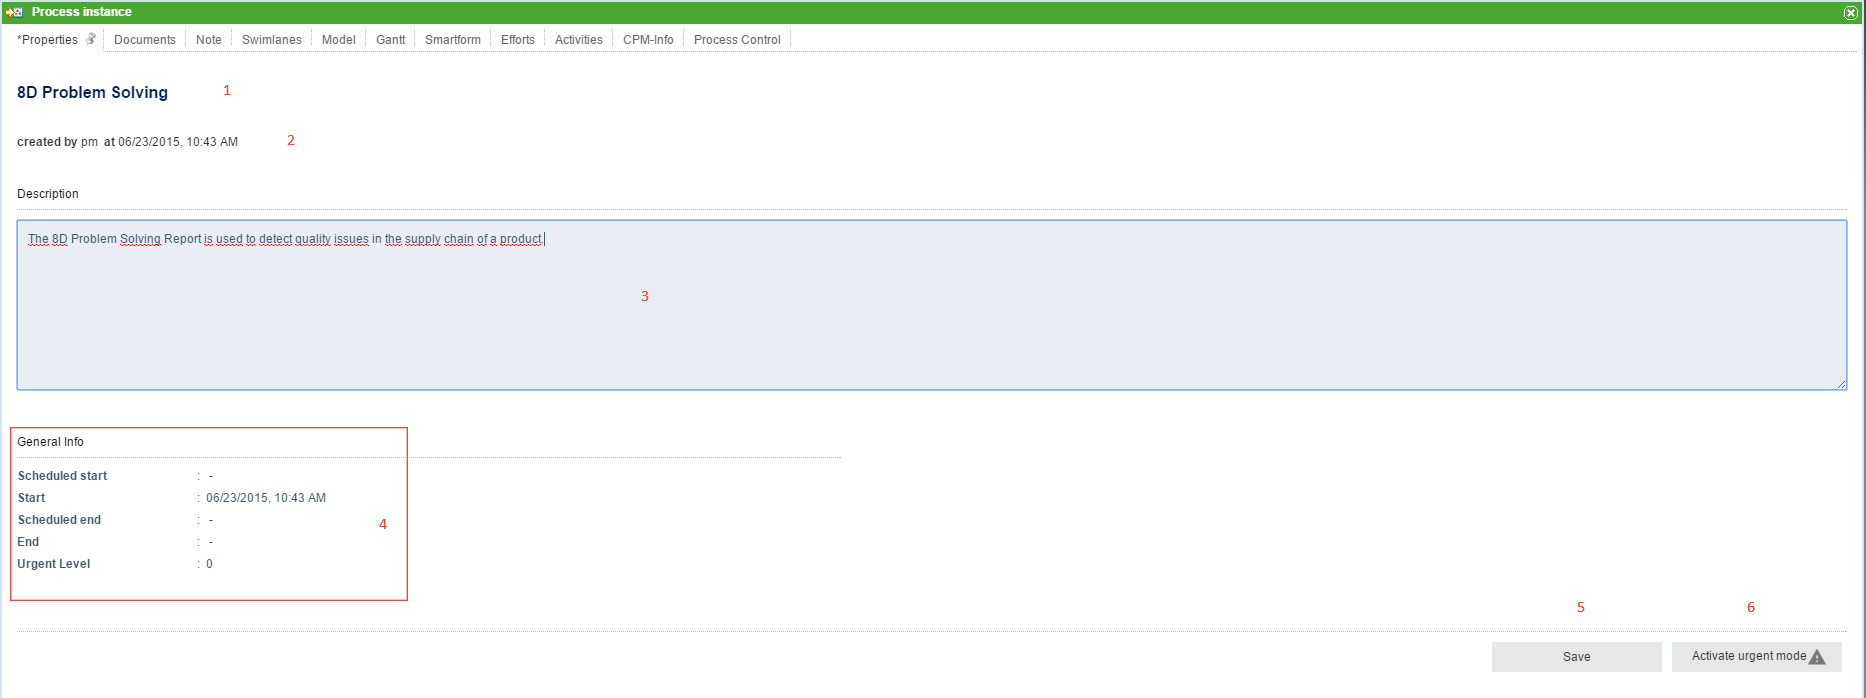
| 1 | Name of the instance. |
| 2 | Information about the user who started the instance and at what time the instance was started. |
| 3 | A description of the instance, which can be edited. |
| 4 | Information about the process start is found here. The scheduled start/end and the actual start/end are displayed as well as the urgency level. |
| 5 | If the description field is edited, the changes can be saved by clicking this button. |
| 6 | Clicking this button activates the urgent mode. |
Documents
This tab shows the same content as the context menu.
Note
The notes associated with this process instance can be viewed here. See notes.
Swimlanes
This tab shows an overview of all swimlanes as well as the corresponding assigned groups and actors.
| Element | Description |
|---|---|
| 1 | The name / identification of the swimlane as it appears in the process model is displayed here. |
| 2 | The current actor of the swimlane, if existent, is displayed here. |
| 3 | The current acting group, if existent, is displayed here. |
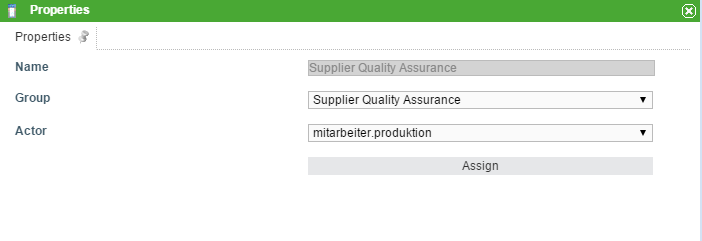
If there is currently no actor, one can be selected in this window; the same applies for groups. If both a user and a group are selected, then all activities are assigned directly to the user.
Using the two drop-down menus, a group and a user can be selected and assigned to the swimlane. If a user is already assigned to the swimlane in the process model, only the groups in which the user is a member can be selected; however, any user may be chosen.
If a group was selected in Signavio, the group can be chosen freely; however, the user must be a member of this group.
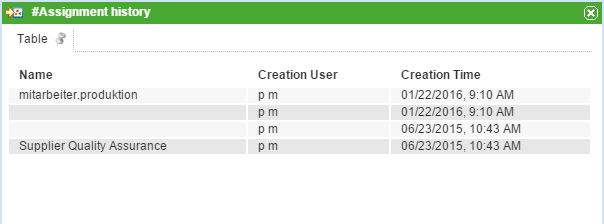
The allocation history, which shows when and what change has been made, can be viewed by right-clicking on the swimlane.

Graph
The tab Graph shows a process model. The status of the process is highlighted by a colored frame around the current instance.
Gantt chart
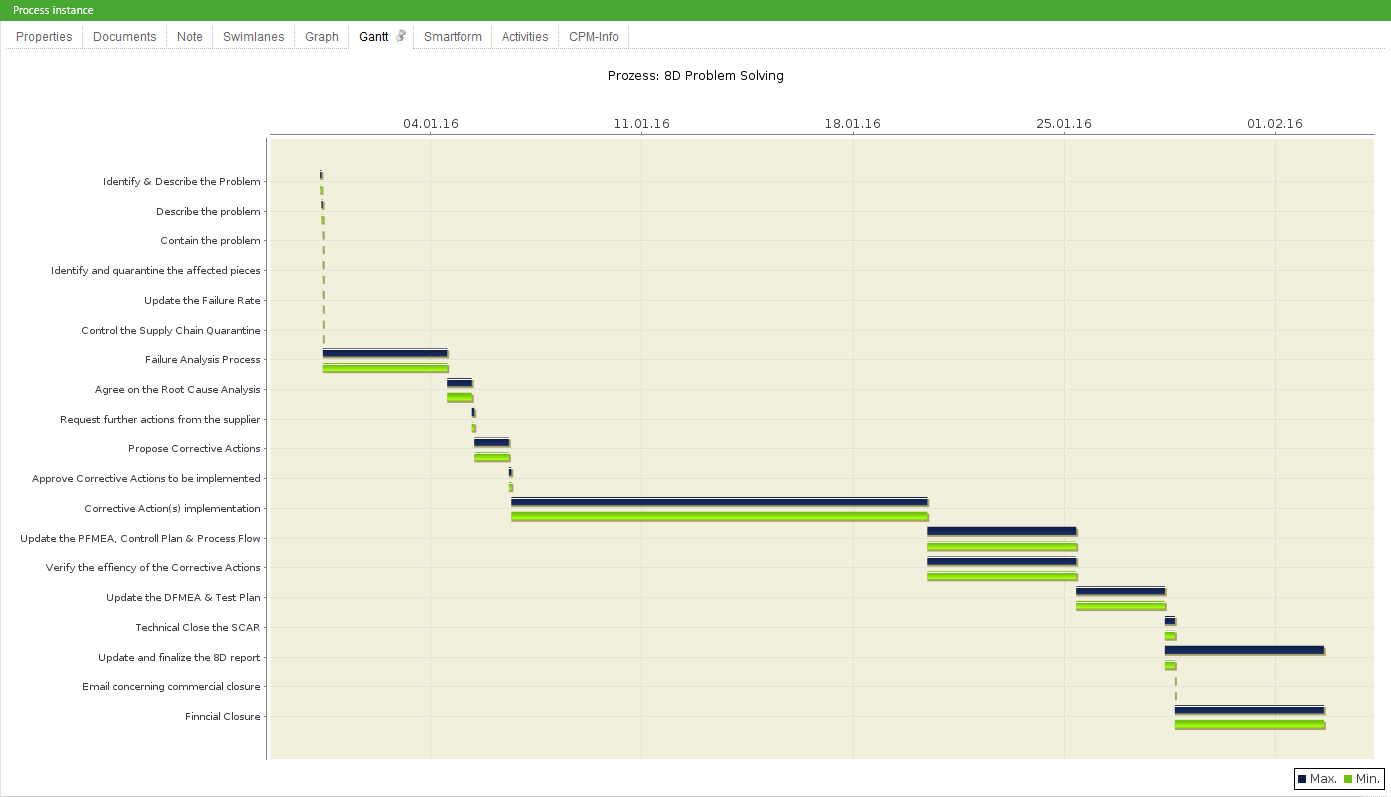
The Gantt chart provides an overview of all the processing times of each activity. The green bar represents the fastest processing time from the earliest start time to the earliest finish time . The blue bar corresponds to the longest processing time from the earliest start time to the latest finish time .
Smartform
This tab contains the Smartform, which presents information about this specific process instance.
Activities + CPM Info
See CPM.


