| element | description |
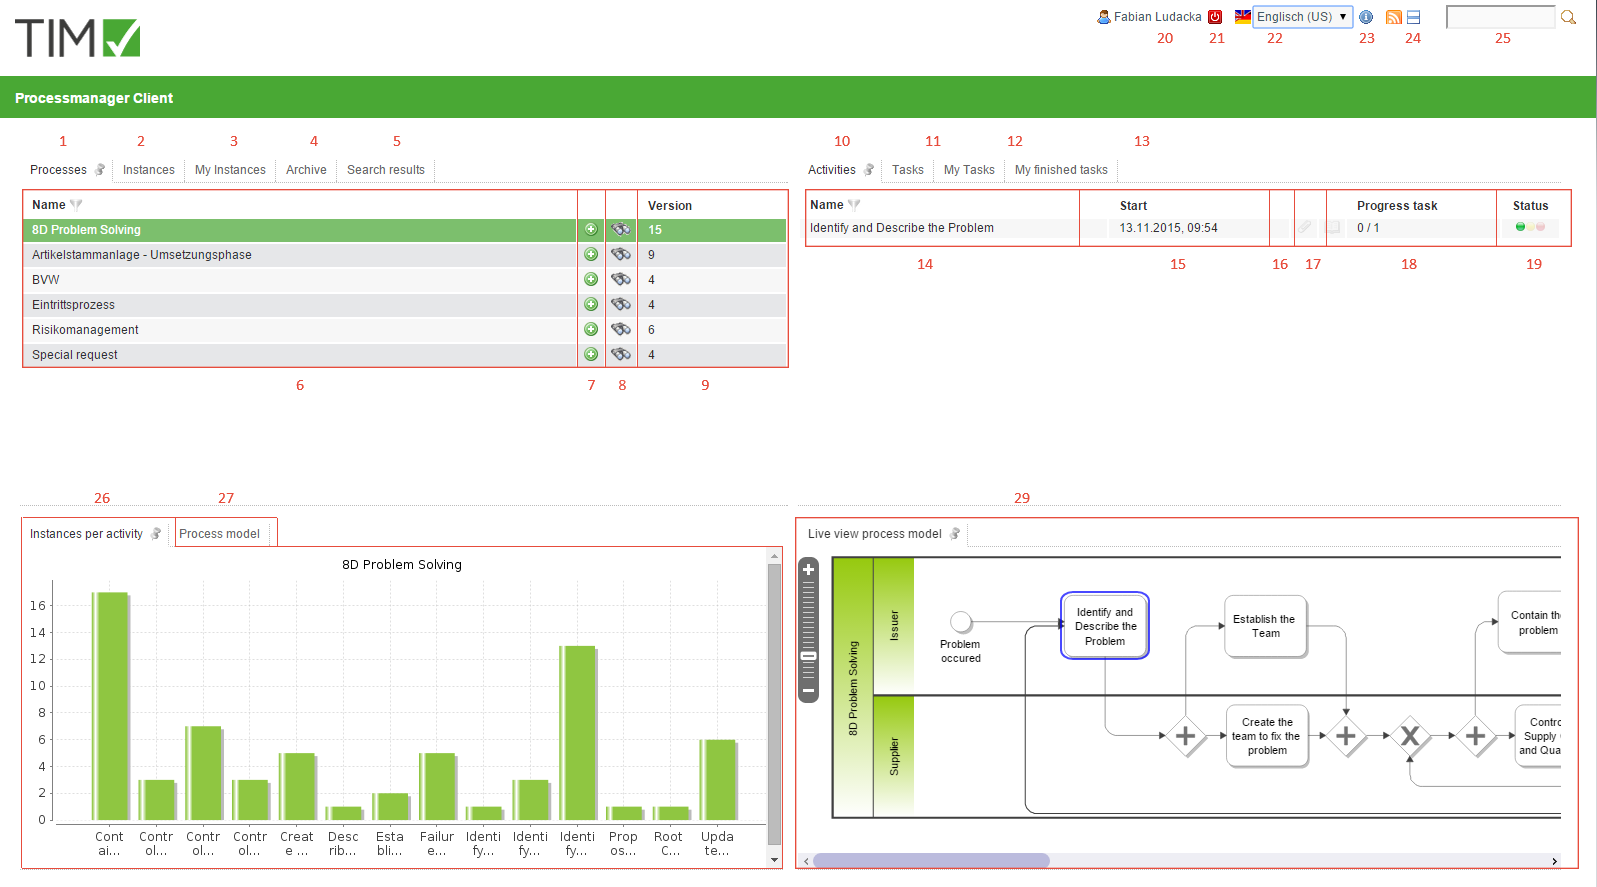
| 1 | This tab shows the process manager all the process definitions to which he has access. |
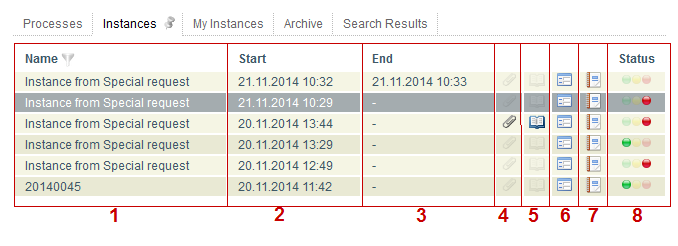
| 2 | If a process definition is chosen in the first tab, currently activated instances of this definition will then be displayed in the tab “instances”. See instances list |
| 3 | If a process definition is chosen in the first tab, currently activated instances of this definition, which have been initiated by the current user, will then be displayed in the tab “my instances” |
| 4 | The tab “archive” displays all instances of a chosen definition which have been completed and archived. |
| 5 | This tab displays the instances in which the search (see also Element 8 and Element 26 respectively!) has found corresponding process variables. |
| 6 | In this slot the name of the process definition is displayed. |
| 7 | It is possible to initiate a new instance for this process definition via clicking on the plus symbol. |
| 8 | In this slot you can search via the smartform. The search will be conducted for process variables containing required search terms which in turn correspond to certain process definitions. The results are then displayed in the slot dedicated to search result. See search » Attention! This does not work with the ToDo-Client 1G |
| 9 | Here, the version of the currently deployed process definitions will be displayed. If a process definition is newly deployed, the versioning is increased by the digit 1. |
| 10 | If a process definition and correspondingly a currently acvtivated instance is chosen, an overview of the status of current activities assigned to the instance will be displayed in this slot. |
| 11 | If an activity from the list of activities (please refer to Element 10!) is chosen, a list of the tasks which are assigned to the chosen activity will appear in the tab “tasks”. |
| 12 | If an activity has been chosen, all activities for which the current user is listed as the instigator and the task itself, which has been assigned to one of his groups, will be displayed under “My activities”. |
| 13 | In this column, all tasks which have been completed by the current user and are not yet archived, can be viewed here.» From version v.3.4.7 onwards, archived tasks will be displayed too. In the client profile it is possible to configurate whether or not completed tasks of a group shall be displayed. |
| 14 | The name of active activities will be displayed in this column. |
| 15 | The date and time when an activity was started or when the process has reached the activity, will be displayed here. |
| 16 | Via this symbol you can get access to the menu by which documents can be uploaded or already uploaded documents can be opened. If the symbol is highlighted by colour, uplaoded documents are available. |
| 17 | Via this symbol you get to the menu in which notes can be added or already added notes can be looked into. If the symbol is highlighted with colour, notes are deposited. |
| 18 | The number of tasks available in a chosen activity and how many of them have already been completed will be displayed here. |
| 19 | The latest possible ending time for this activity will be displayed here. Please refer to CPM for further information. |
| 20 | This traffic light symbol tells you if an activity is on schedule. Please refer to CPM for further details. |
| 21 | Via a click on the user you get access to the user settings in which your own personal user profile can be adapted. Please read the entry User profile for any further details. |
| 22 | The current user can sign out here. |
| 23 | The preferred language can be chosen from a drop-down menu. |
| 24 | Here, the current T!M version and revision can be accessed. The latter is crucial for support issues if an error has occured. |
| 25 | Via this symbol you can switch between the Processmanager-Client 4G and the Processmanager 2G. |
| 26 | Here, you can search for texts/numbers in all processes (in all process definitions and their related process instances). Relevant data entail the definition name, instance name and the process variables. Fitting results are displayed in the search results field. |
| 27 | In this area a graphic is displayed in which information on currently active activities is given. |
| 28 | Under the tab “Process model” a small figure is displayed which shows the entire process and its activities. |
| 29 | The Live View process model shows the entire process model and additionally indicates the current status of the process. |

