
Table of Contents
Dashboard - Overview
Dashboard Login
 Currently, every user can login to the dashboard with his/her own personal login data. It is possible to individualize the displayed information for the user. A new dashboard can be generated by selecting the item dashboards in the menu.

Adding and Creating Widgets
 A dashboard can contain as many widgets as desired by the user. A widget can display almost any piece of information and has to be defined by an administrator. It is not possible to add a console widget (by which all existing information can be processed) if the current (logged-in) user does not have administrative rights.
Please refer to the following information for more on the types of charts and structures that can be used in TIM.
The development of widgets requires knowledge of SQL, which also conforms to the standards of MySQL syntax.
- SQL examples
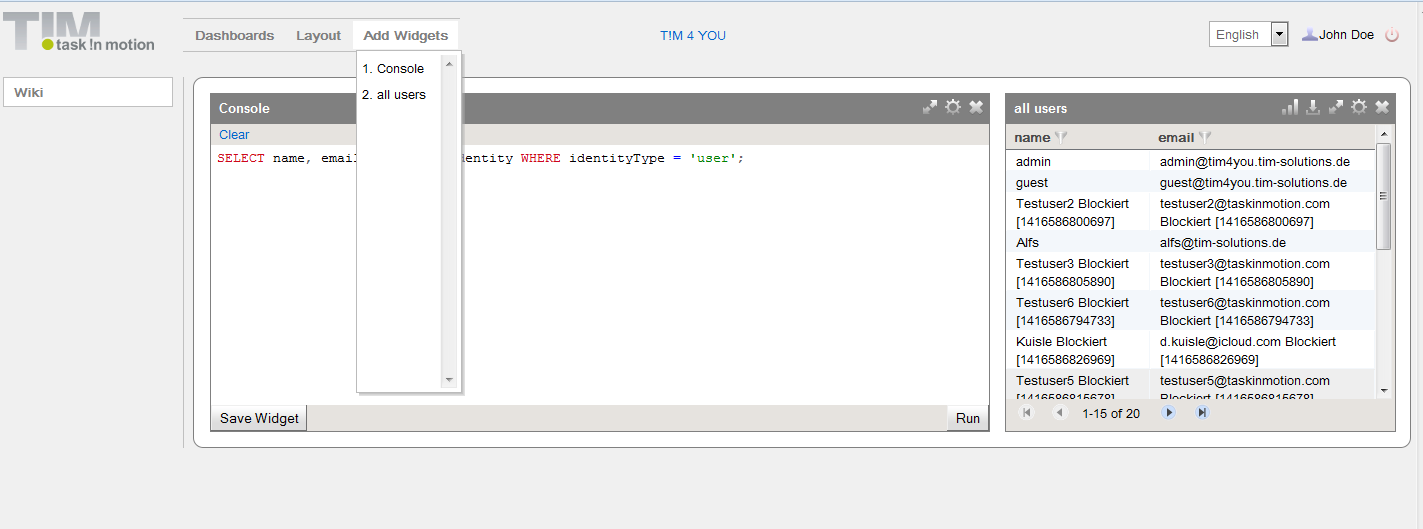
SELECT name, email FROM view_identity WHERE identityType = 'user';
In this example, the widget provides an overview of all existing users in the system. Please refer to this page to access further examples.
How to Save a Widget
 A widget providing the desired content can be saved and then eventually made accessible to other users for their own benefit. To save a widget, click on the button “Save a Widget”. A user-defined name has to be given to the widget.
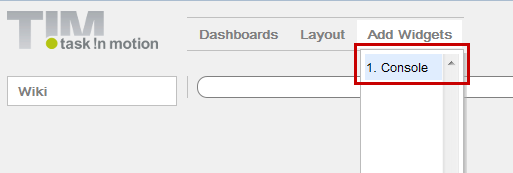
In this example, the widget is named All Users and is selected via the menu “Add Widgets”.
Layout and Arrangement
The arrangement of the widgets can be performed automatically by selecting the desired layout from the menu, as shown in the preview. The layout selection will always effect the design of the dashboard currently being accessed. If a widget is improperly located within the Dashboard, it can easily be moved onto another tile. The exact size and shape of the widget are then set in accordance with the predefined layout.


Widget Menu
| Symbol | Function |
|---|---|
| This item on the menu allows the widget information to be displayed graphically in a diagram | |
| This item on the menu exports the complete content of the widget to a single file in Excel-format | |
| This item changes the widget size to be displayed with the largest possible width | |
| This item opens the printer dialog of the local computer | |
| This option enables the user to set the diagram type, and remove or delete a widget from the Dashboard |
Graphical Analysis of Widgets
If the user wishes to display the widget information graphically, this can be easily and flexibly implemented. For correct implementation, X- and Y-axes have to be created. In the current example, this is not possible to do because an axis cannot be created based solely on entities such as “name” and “Email”. To create the graph, a new widget, showing how many users were generated on each weekday, needs to be generated.
SELECT DAYNAME(creationtime) AS Tag, COUNT(DAYNAME(creationtime)) AS NUMBER FROM view_identity GROUP BY DAYNAME(creationtime)
This can be saved in the usual manner and then added to the dashboard. Next, the diagram symbol/function can be used to set the X- and Y-axes. If a specific type of diagram is desired, this is modified via the widget configuration settings.

Working with Variables
The dashboard enables widgets to be displayed based on the selection of particular variable's value. For instance, in the first example not every user should be displayed by the widget. Rather, the user should be able to select the information to be displayed. To enable this function the widget has to be changed as follows:
SELECT name, email FROM view_identity WHERE identityType = :identType
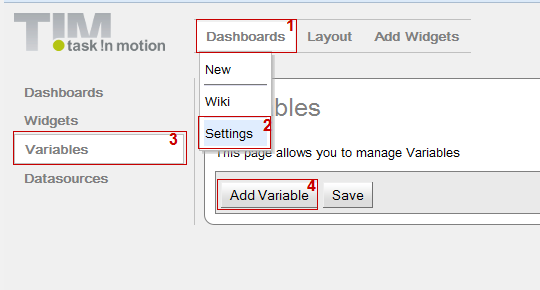
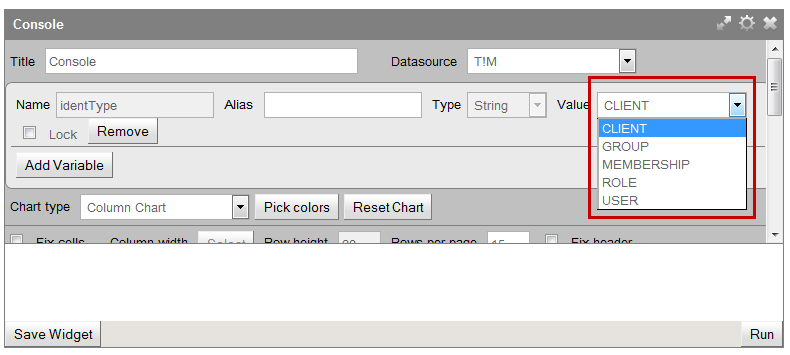
In a second step, the desired content of the variable is defined. To do this the following menu items must be selected: Dashboards → Settings → Variables
By clicking on the button “Add Variable” an input field enabling the definition of the variable is displayed. The following fields are now available:
- Name - enter here the name of the variable
- Type - this indicates if the output is formatted as letters, numbers or dates
- Returns - This indicates if the result is a single output or a list of multiple outputs
- Query - the content of a variable can be defined within this field by using MySQL syntax
- Execute - this shows the test results of the variable
- Remove - this function will delete the complete variable from the system
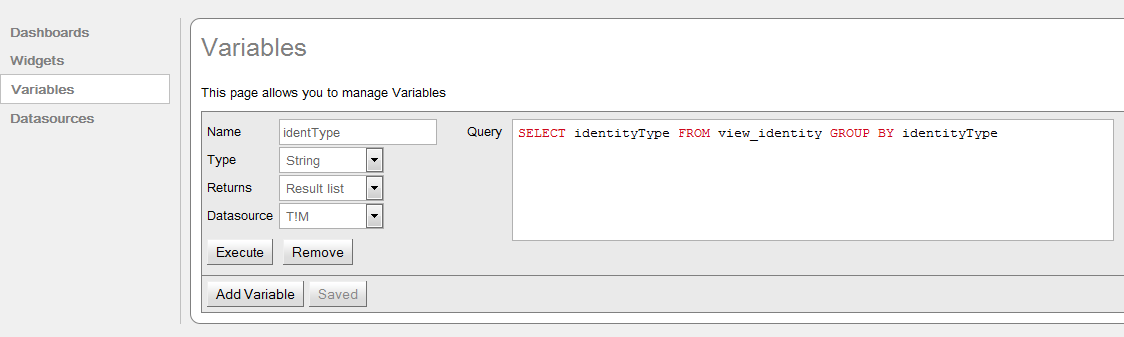
- Variable identType
SELECT identityType FROM view_identity GROUP BY identityType
To test this variable, the user should execute the variables before saving and 5 results should be returned.
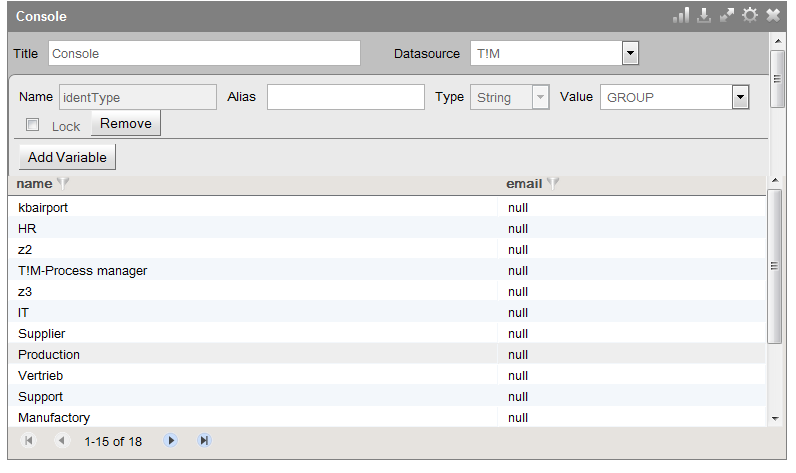
 After this, the value of the variable can be defined and confirmed within the widget configuration menu by clicking OK. The new content will be adapted to reflect the system and the variable settings. The selection will look as depicted below after the widget has been saved:
Locking Variables

If the variable has been locked, the user is not able to change its value. For example, in the present screenshot the value “user” would always be selected by default. This can only be changed by the owner of the widget. This makes it possible to use a widget for several dashboards, while ensuring that various users only have access to the information for which they are authorized.
Using Global Variables
So-called global variables can be used within the dashboard. The following variables belong to this category:
| Variable | Results |
|---|---|
| :CURRENT_USER_NAME | This names the current logged-in user |
| :CURRENT_USER_ID | This provides the UserID of the user |
| :CURRENT_USER_DEPARTMENT | This shows the department to which the user belongs |
| :CURRENT_CLIENT_NAME | This gives the name of the client |
| :CURRENT_CLIENT_ID | This provides the current ClientID |
| :CURRENT_TIMESTAMP | This shows the current time stamp |
| :CURRENT_EMAIL | Shows the currently registered e-mail addresses |
| :CURRENT_USER_GROUPS_NAMES | This shows to which groups the current user belongs in quotation marks (“,”) |
| :CURRENT_USER_GROUPS_NAME1 | This shows the first group to which the logged-in user belongs |
| :CURRENT_USER_GROUPS_NAME2 | This provides information on any second group in which the currently logged in user is a member |
| et cetera… | |
Approving Predefined Dashboards
 If a dashboard containing all required widgets and settings has been created, this may be distributed to all individuals working together with TIM. Users of this group can then login to the dashboard and have access to its widgets and widget settings.
Authorized access can then be granted by selecting the following items in the menu:
Dashboards → Settings → Dashboards
If a dashboard containing all required widgets and settings has been created, this may be distributed to all individuals working together with TIM. Users of this group can then login to the dashboard and have access to its widgets and widget settings.
Authorized access can then be granted by selecting the following items in the menu:
Dashboards → Settings → Dashboards
Here the configurations of the respective dashboards can be chosen. The user can then select the desired TIM groups (while holding the “Crtl” key) and grant them authorization to the dashboard.

Uploading Reports

If needed, the dashboard can export widgets in a report. These reports may be sent to specific users/groups in regular intervals. For this, a Word file with a table must be composed. The name of the to-be-exported widgets should be placed in the first cell.

Configuring Reports

| Element | Description |
|---|---|
| 1 | Shows the subject of a generated mail. |
| 2 | Shows the content of a generated mail. |
| 3 | Activates or deactivate the report. |
| 4 | Shows the date on which the first report should be sent. |
| 5 | Shows how often the report should be sent, if is it active. |
| 6 | Takes the time from the entry in the Dashboard.properties (see “Generate Automatic Reports”). |
| 7 | Here, the recipients may be chosen from either users or groups. |
—-
Generate Automatic Reports
In order to be able to send the reports automatically, the dashboard.properties (see Installation) must be configured. For this, the following values must be adjusted accordingly. ^ Name ^ Description ^ ^ timerInterval ^ How often i check should be run to see if a report is necessary | ^ timerIdentityName ^ User name that creates the corresponding entry in the EMail_queue (i.e. wiki/dashboard) | ^ timerIdentityPassword ^ The user password | ^ emailSender ^ Here, the engine with which the mails should be sent can be entered. This is “tim” in almost every case. | ^ morningReportHours ^ Gives the time (in hours) at which the report should be sent in the morning (the server time is used as a basis). A value of 10 means 10:00 o'clock | ^ eveningReportHours ^ Gives the time (in hours) at which the report should be sent in the evening (the server time is used as a basis). |